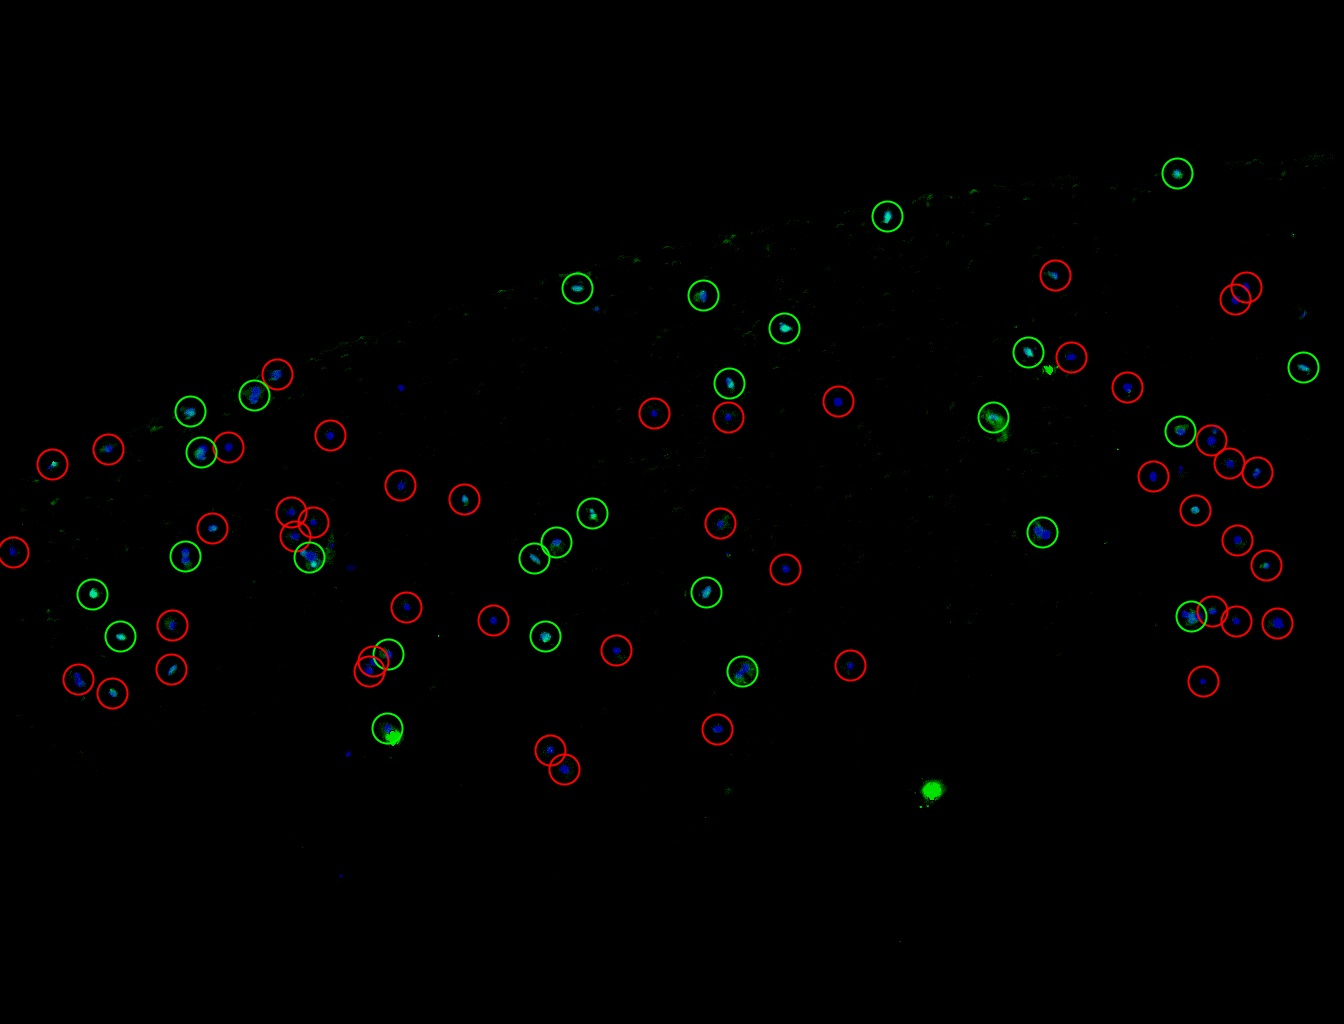
Example 1 – positive cell percents
In this example blue (DAPI nuclear staining) as well as green fluorescence (immunostaining of an interest membrane protein) images were provided. The task was to count positive and negative cells, report the numbers and percent positivity, and provide images highlighting the decision process .

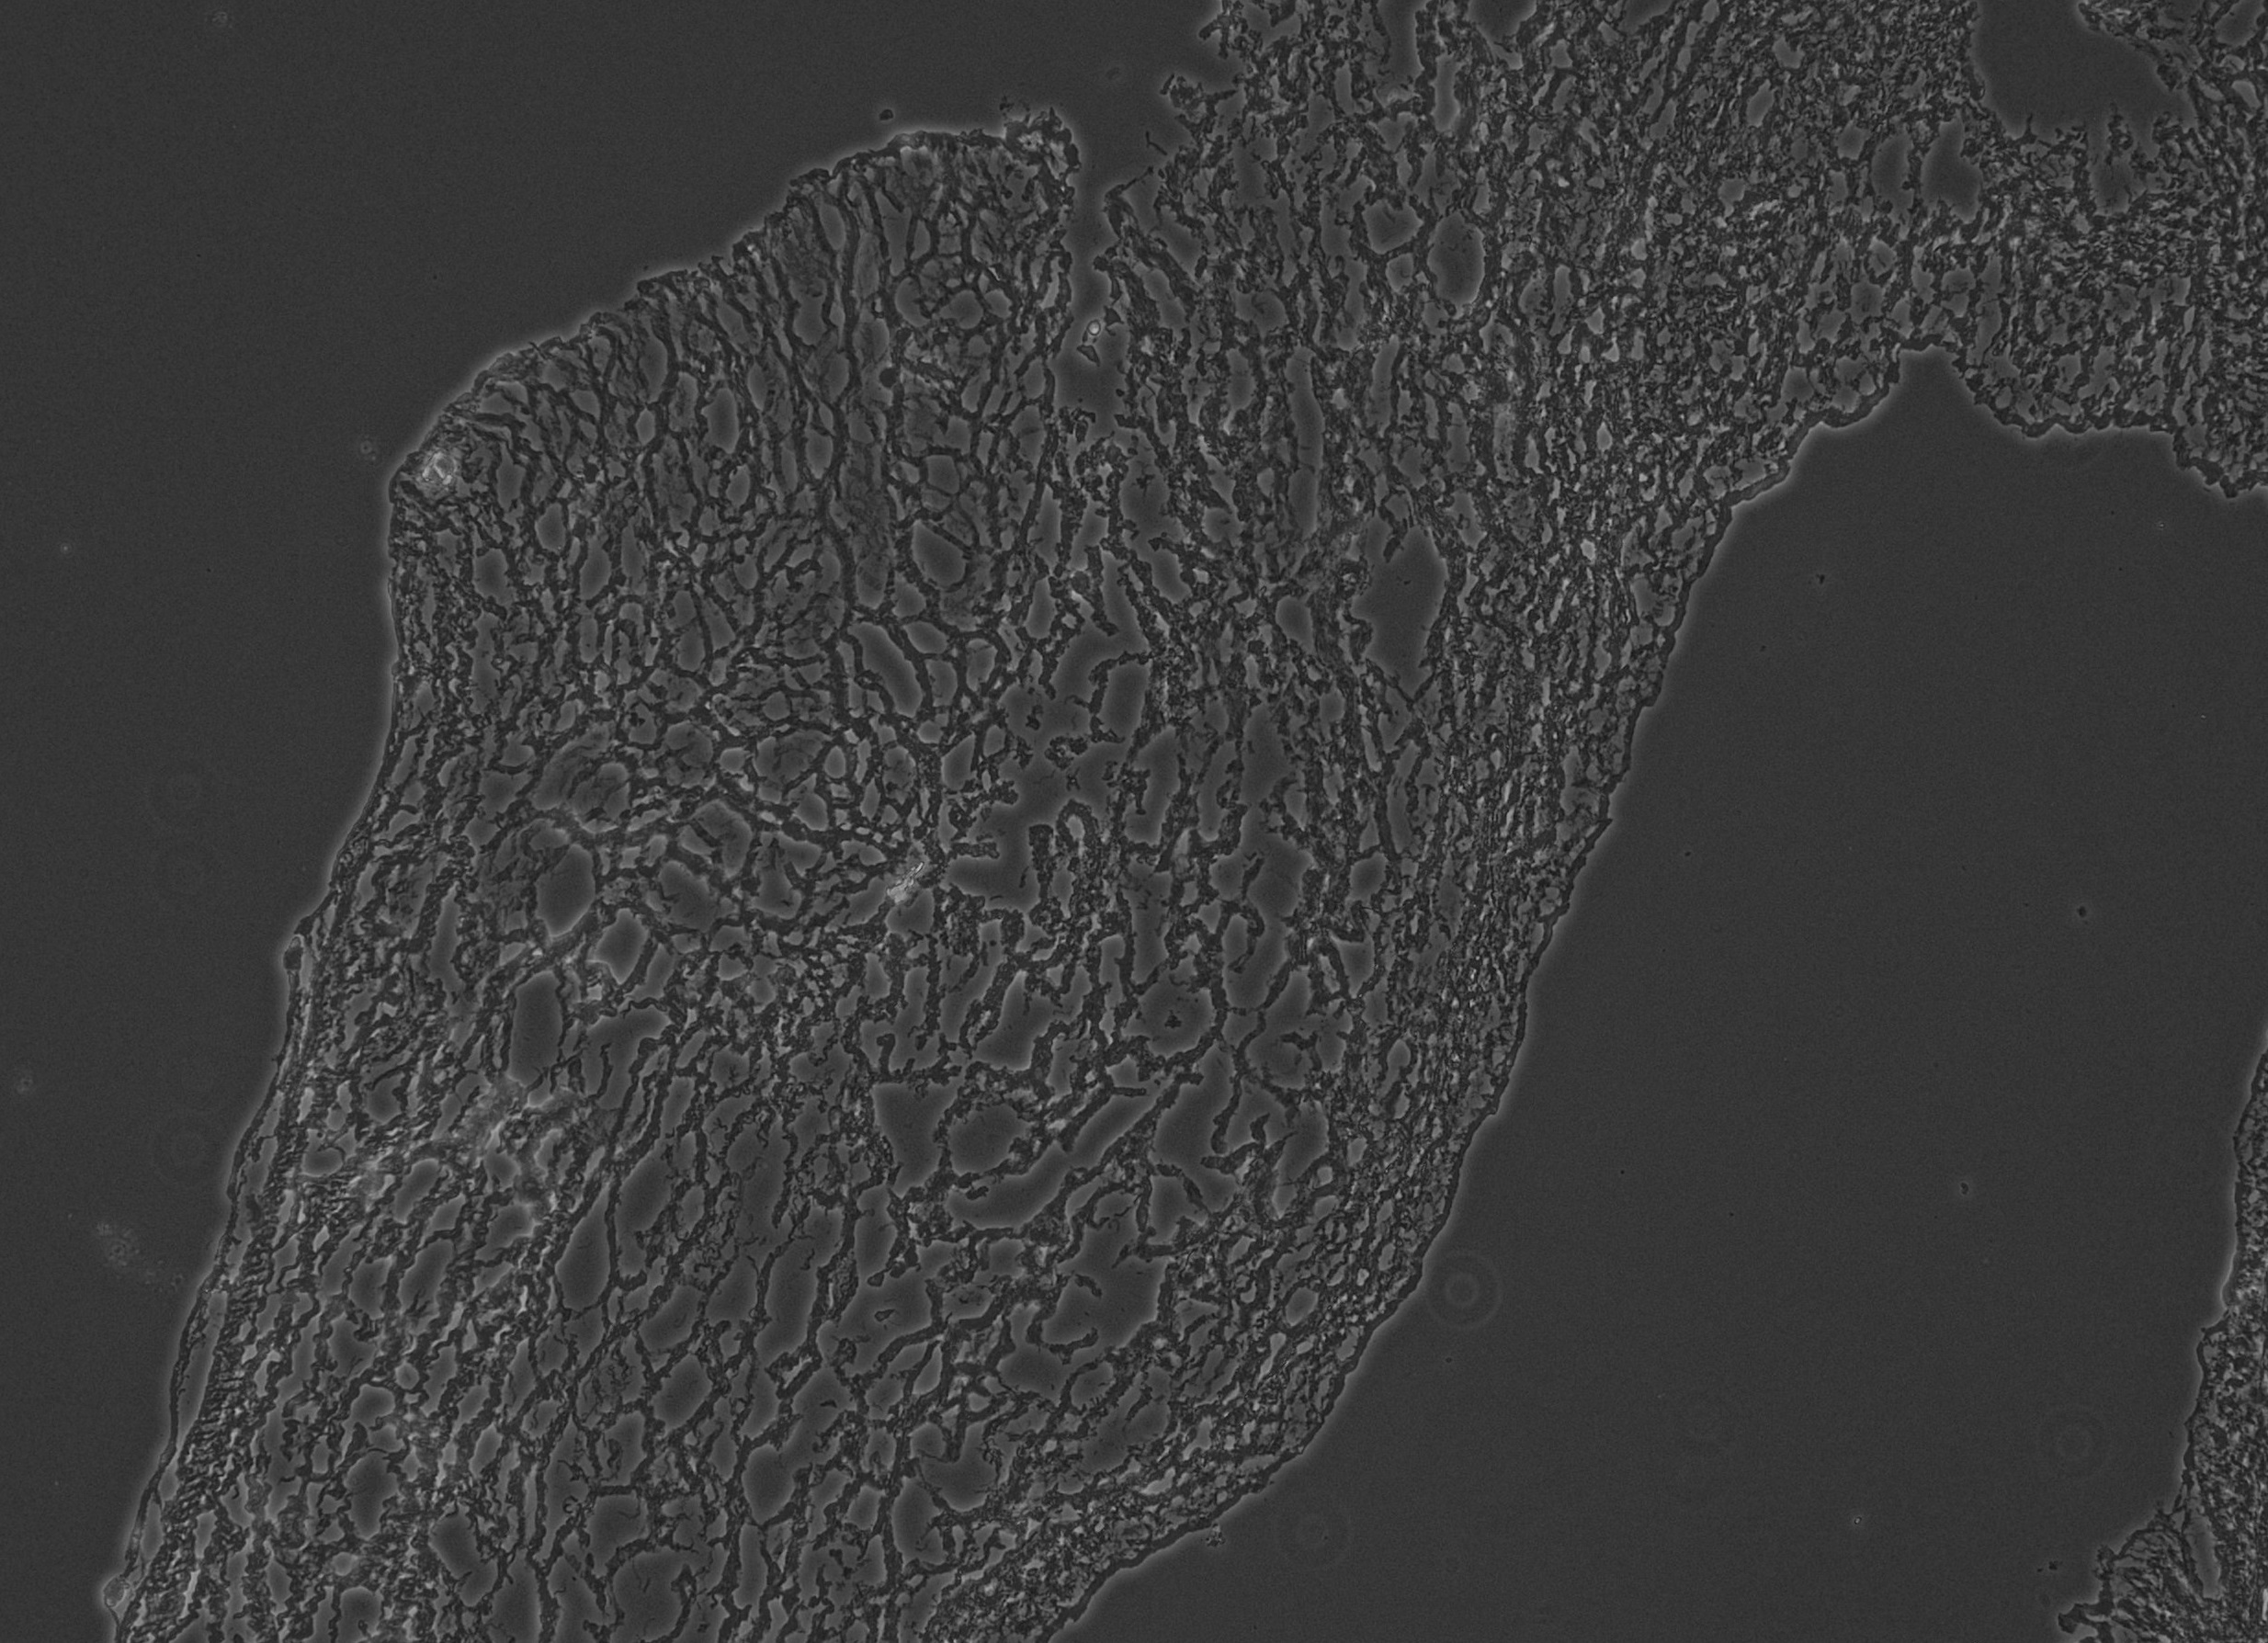
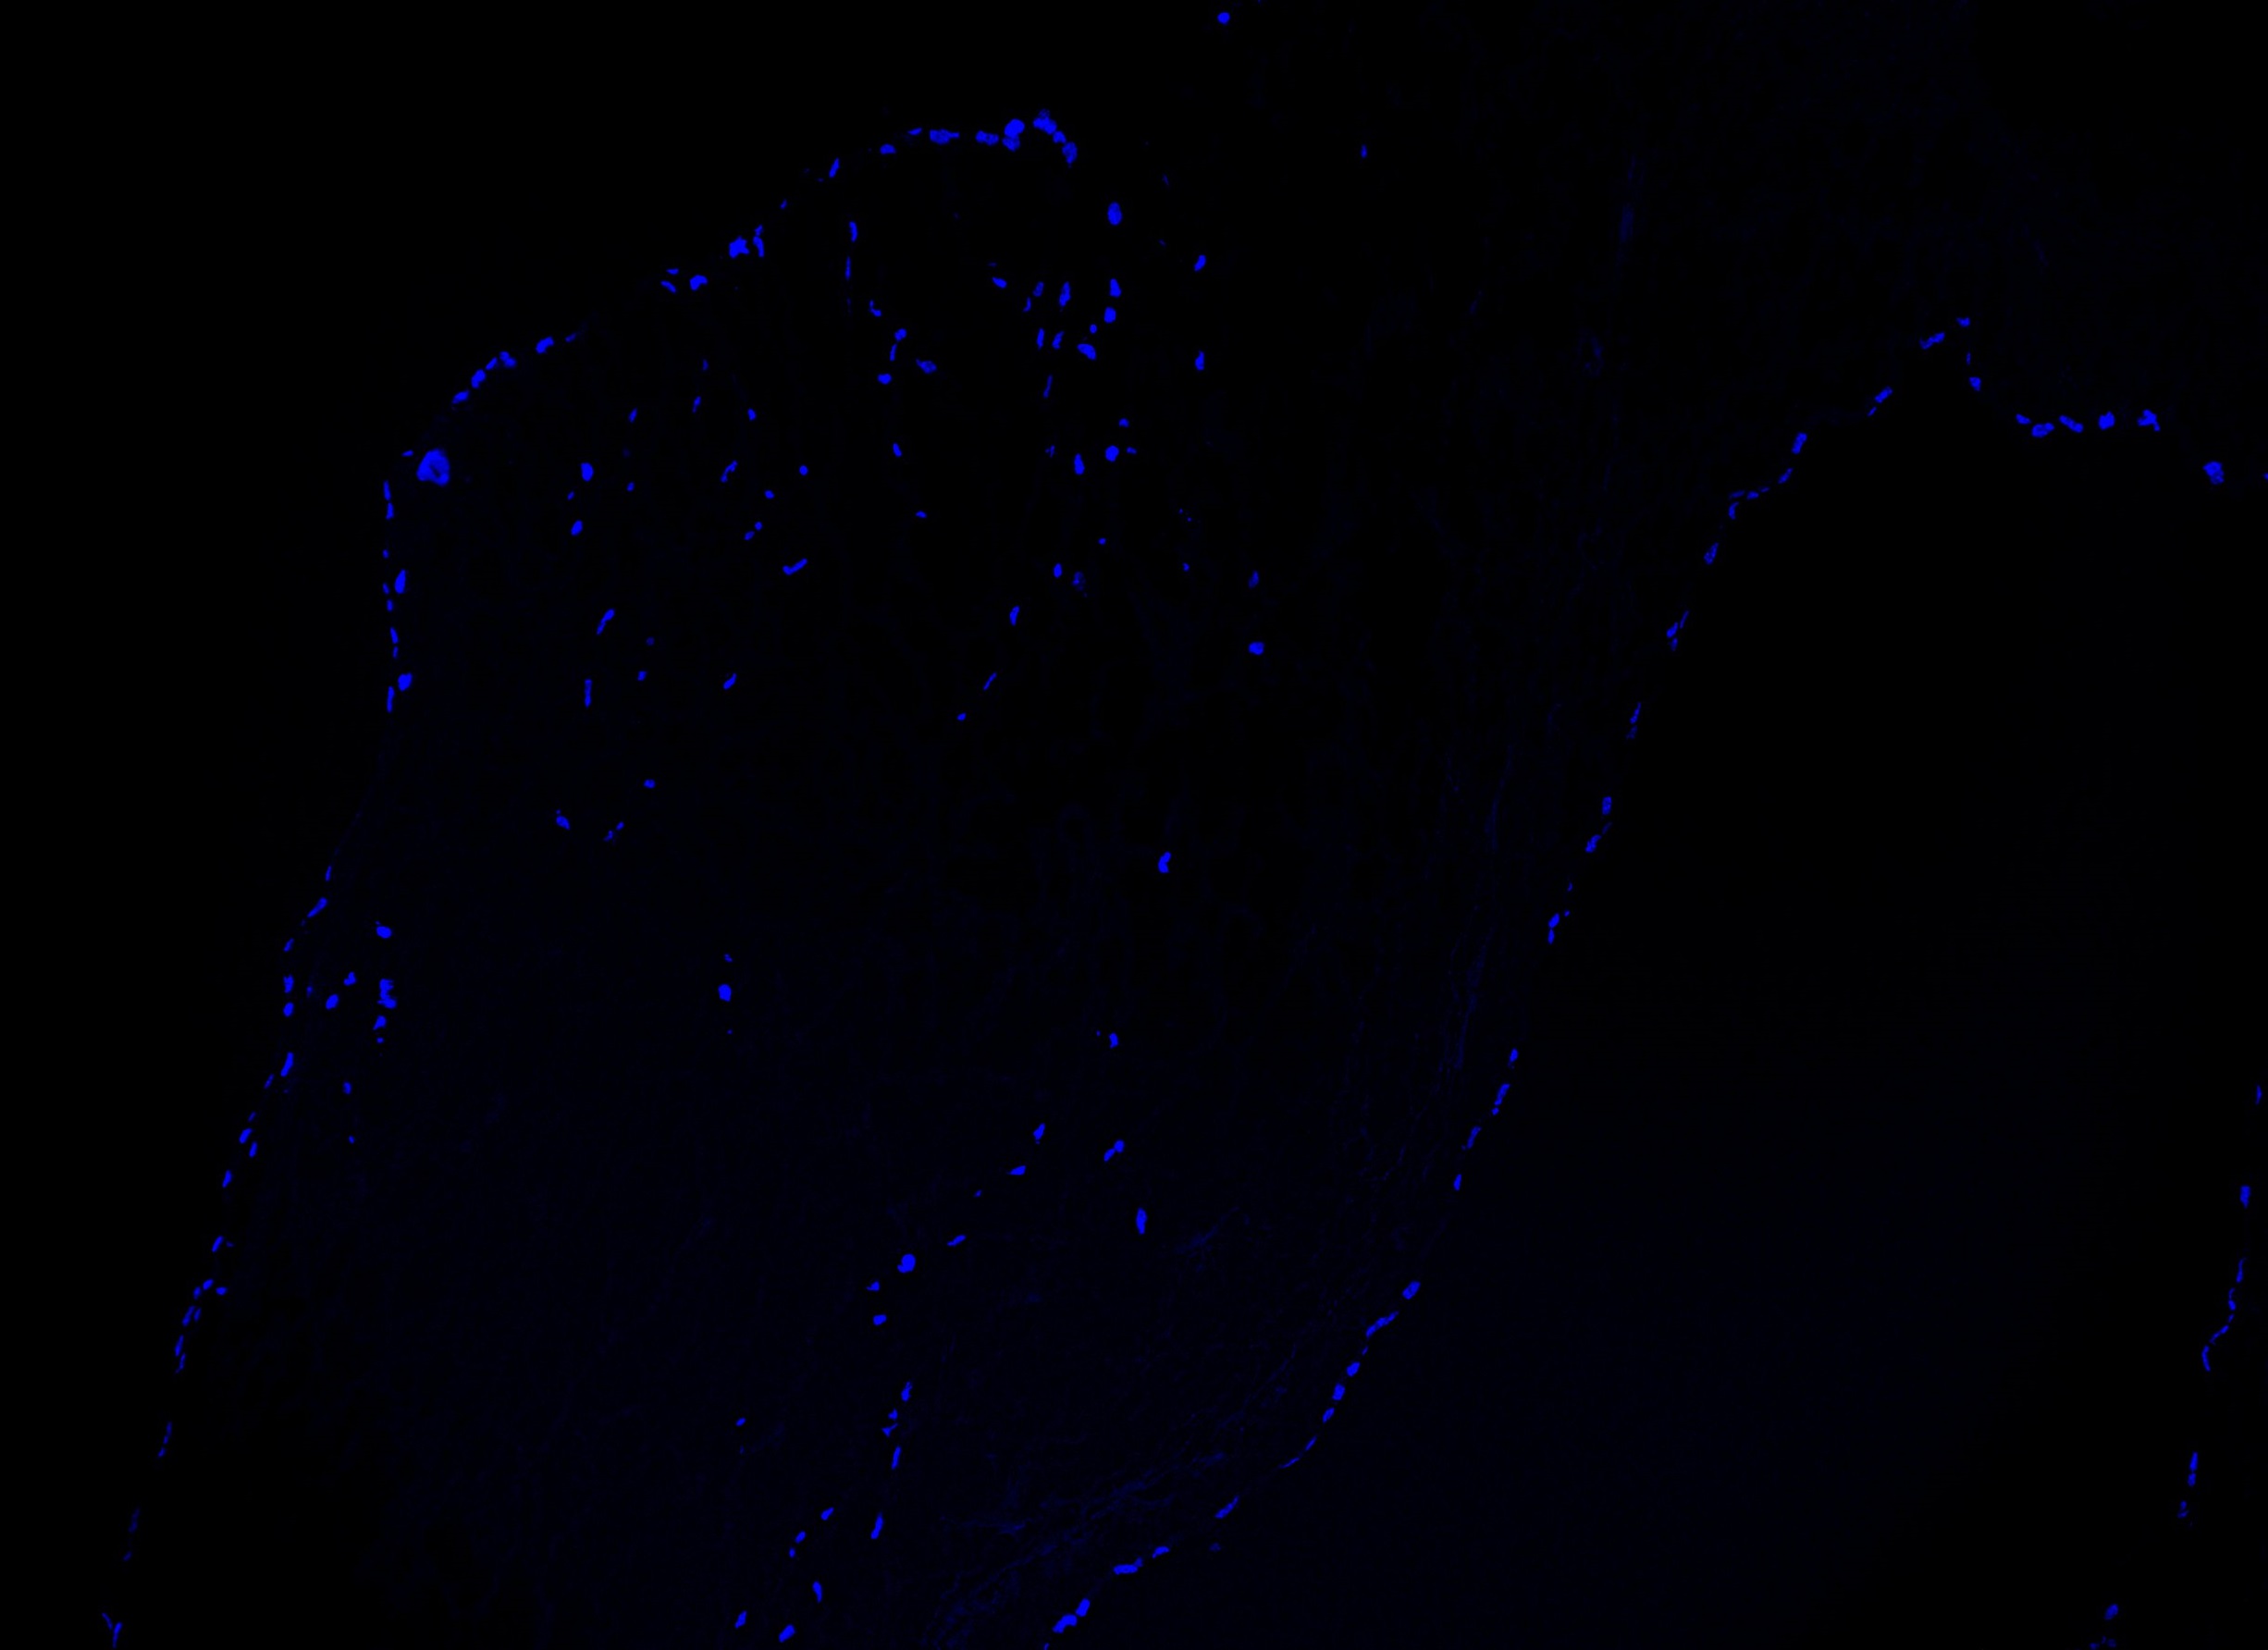
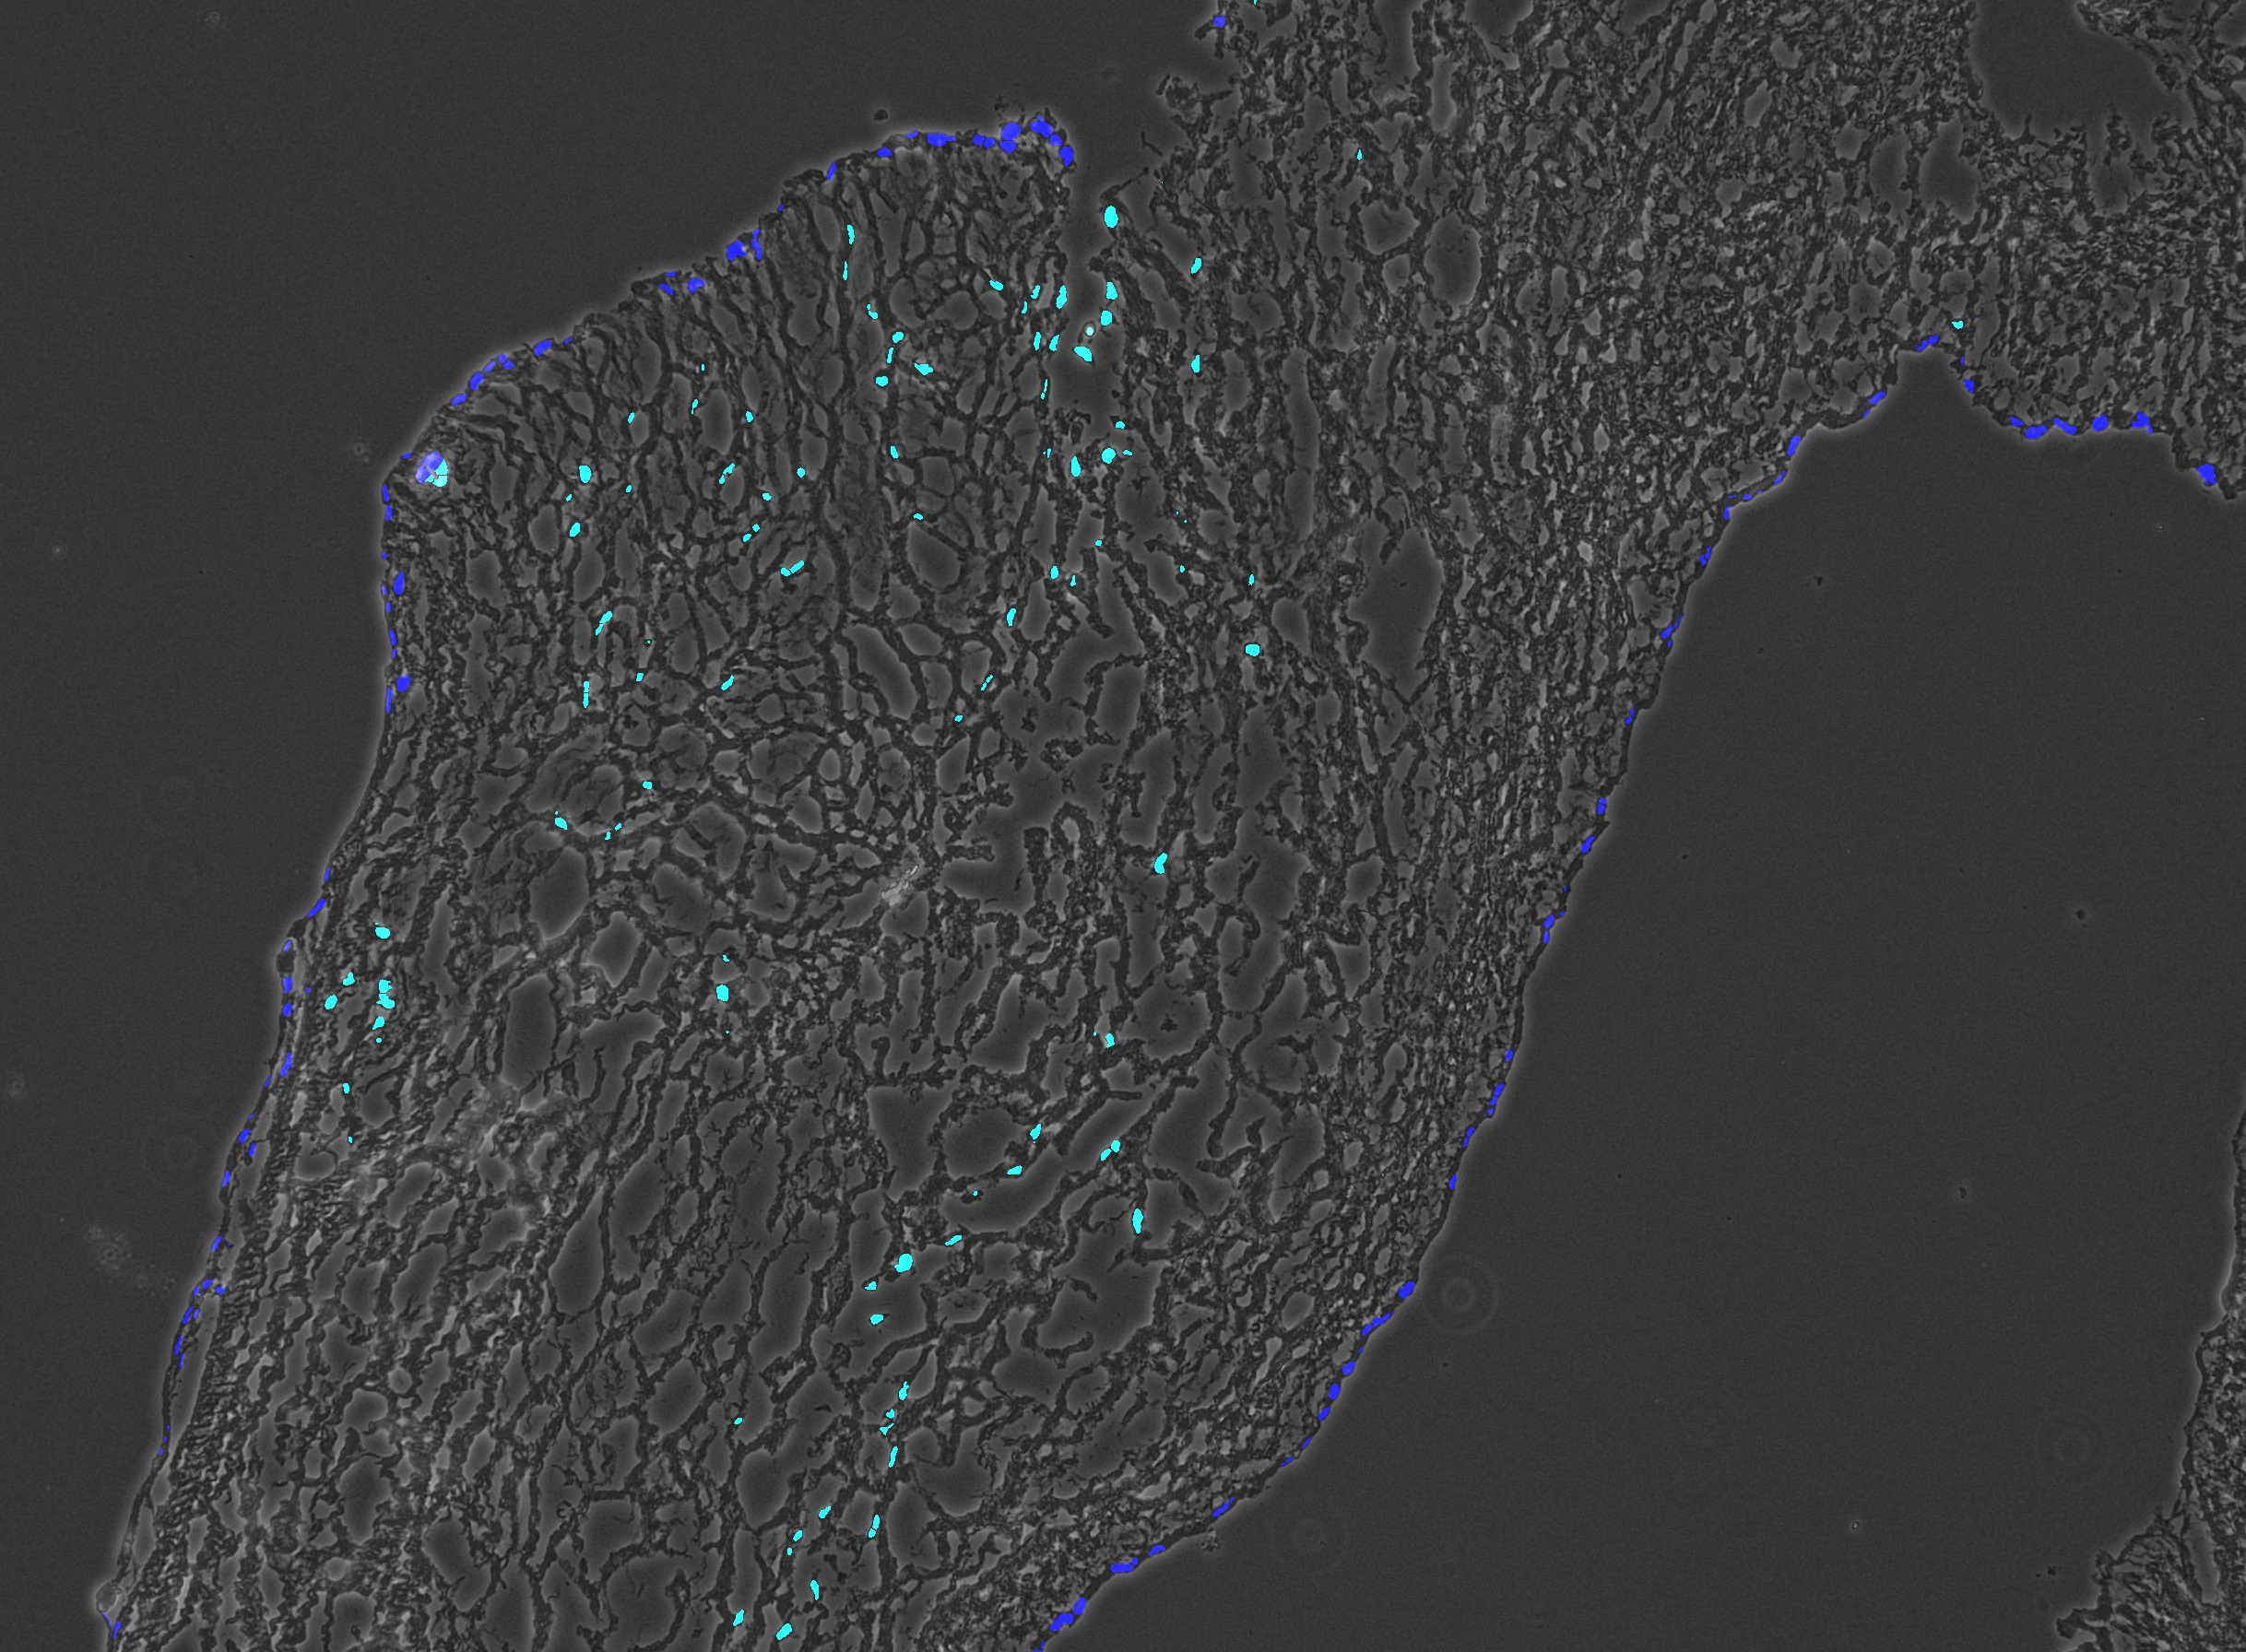
Example 2 – surface versus depth of a 3d structure assayed from 2D sections
In this example, brightfield images and DAPI nuclear staining images were provided. The goal was to count cells on the surface and the cells inside the construct from which the sections were cut.
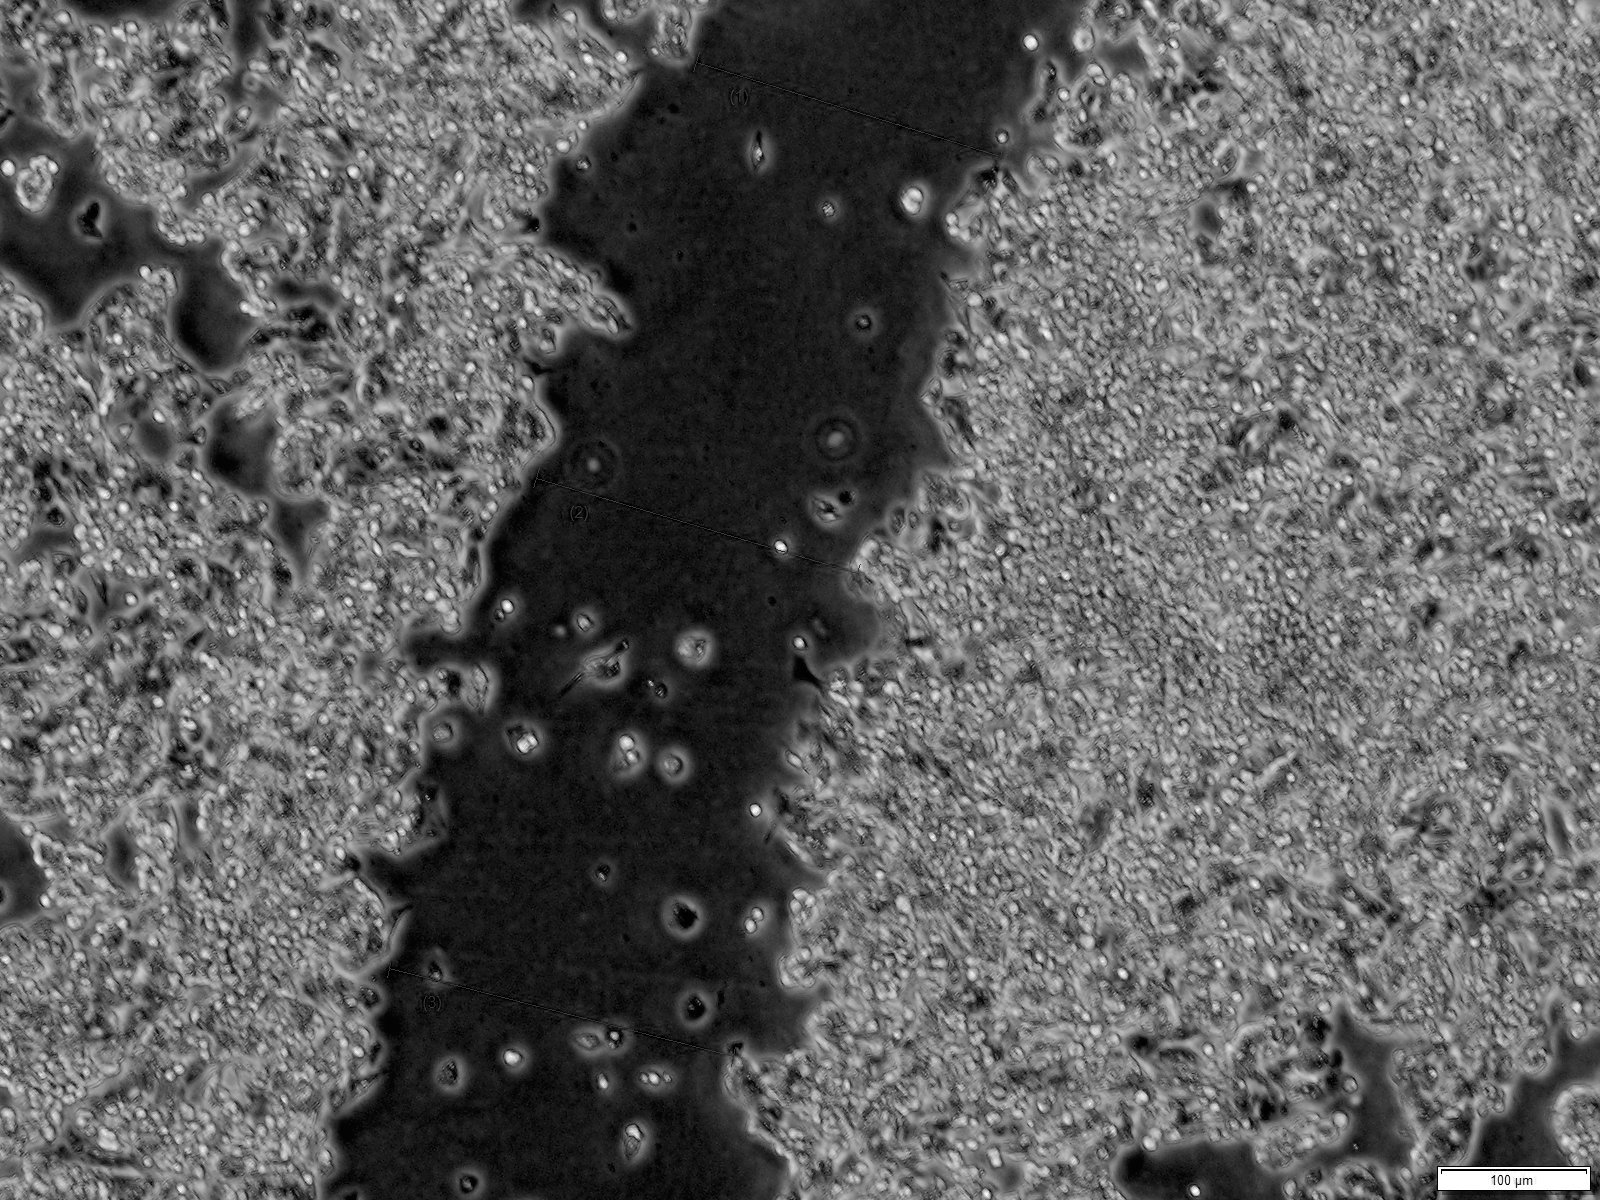
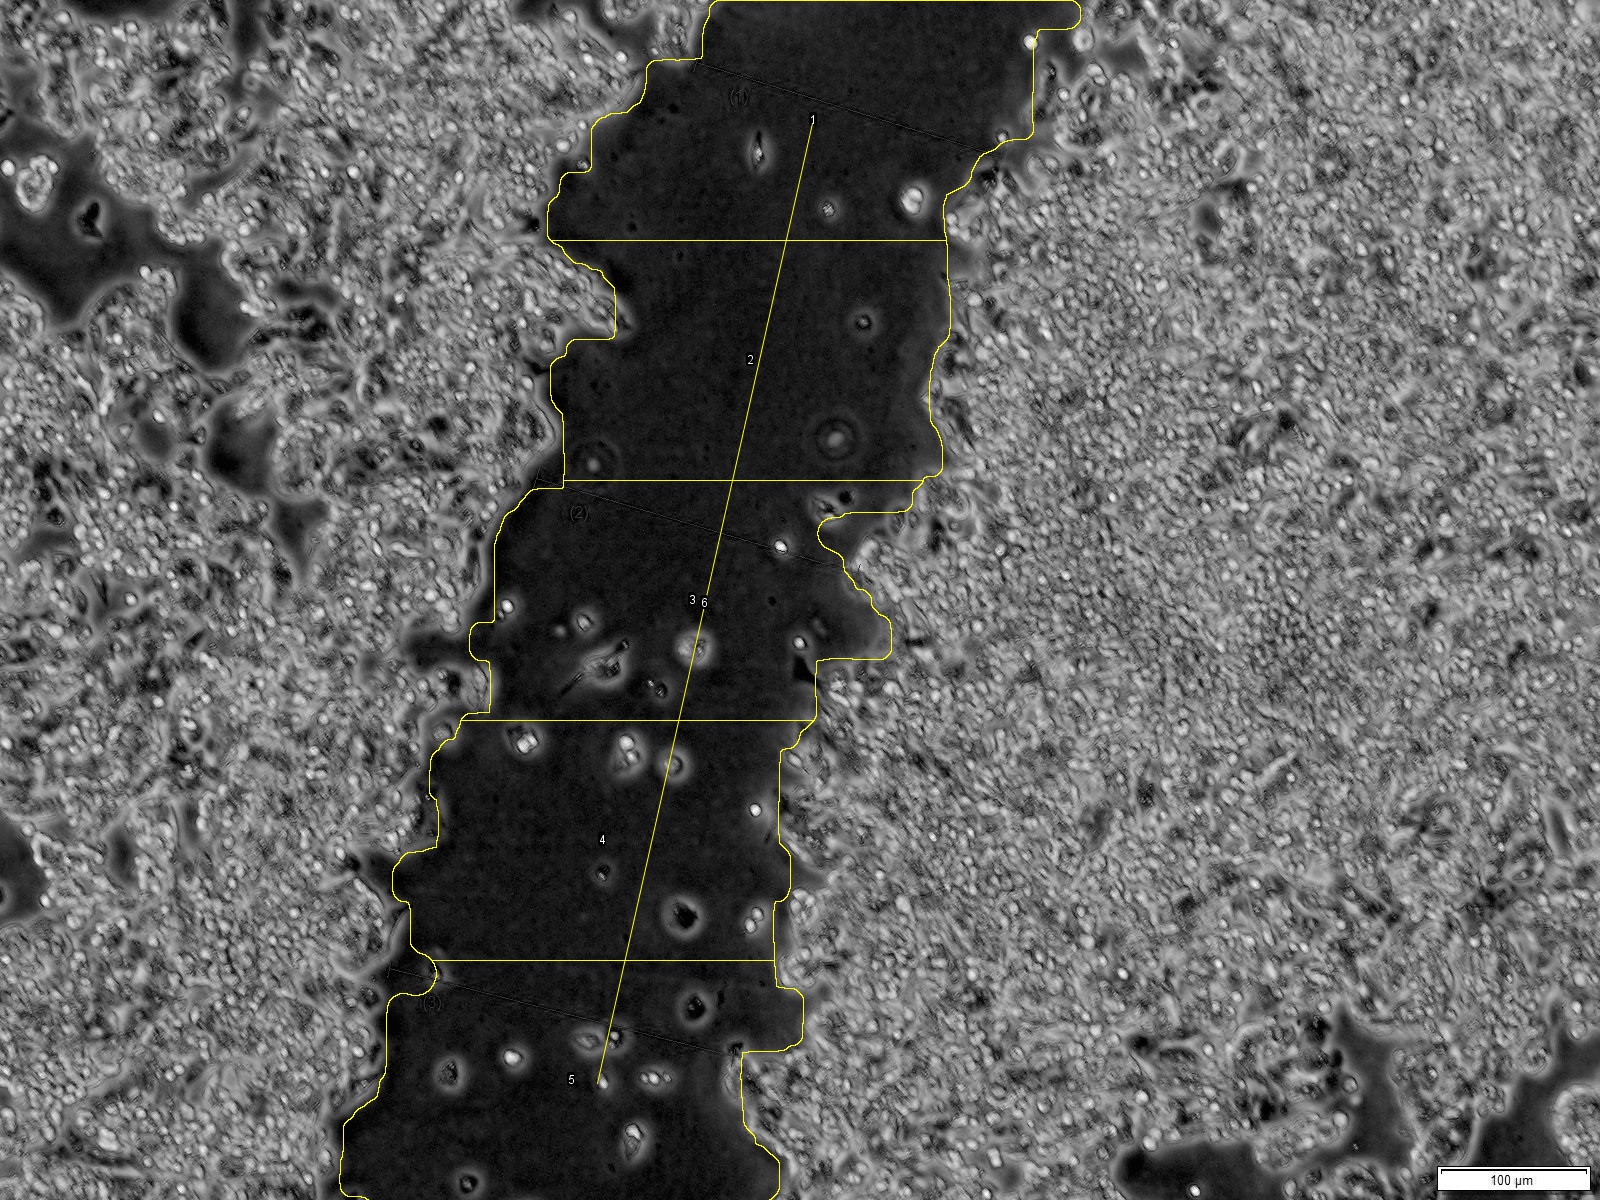
Example 3 – Scratch assay – identify medium width of region
Here, scratch assay images were analysed. The automatic measurements involved first delineating the scratch area and then the identification of the slope for correcting non-vertical regions. The result is the corrected mean width of the scratch area.
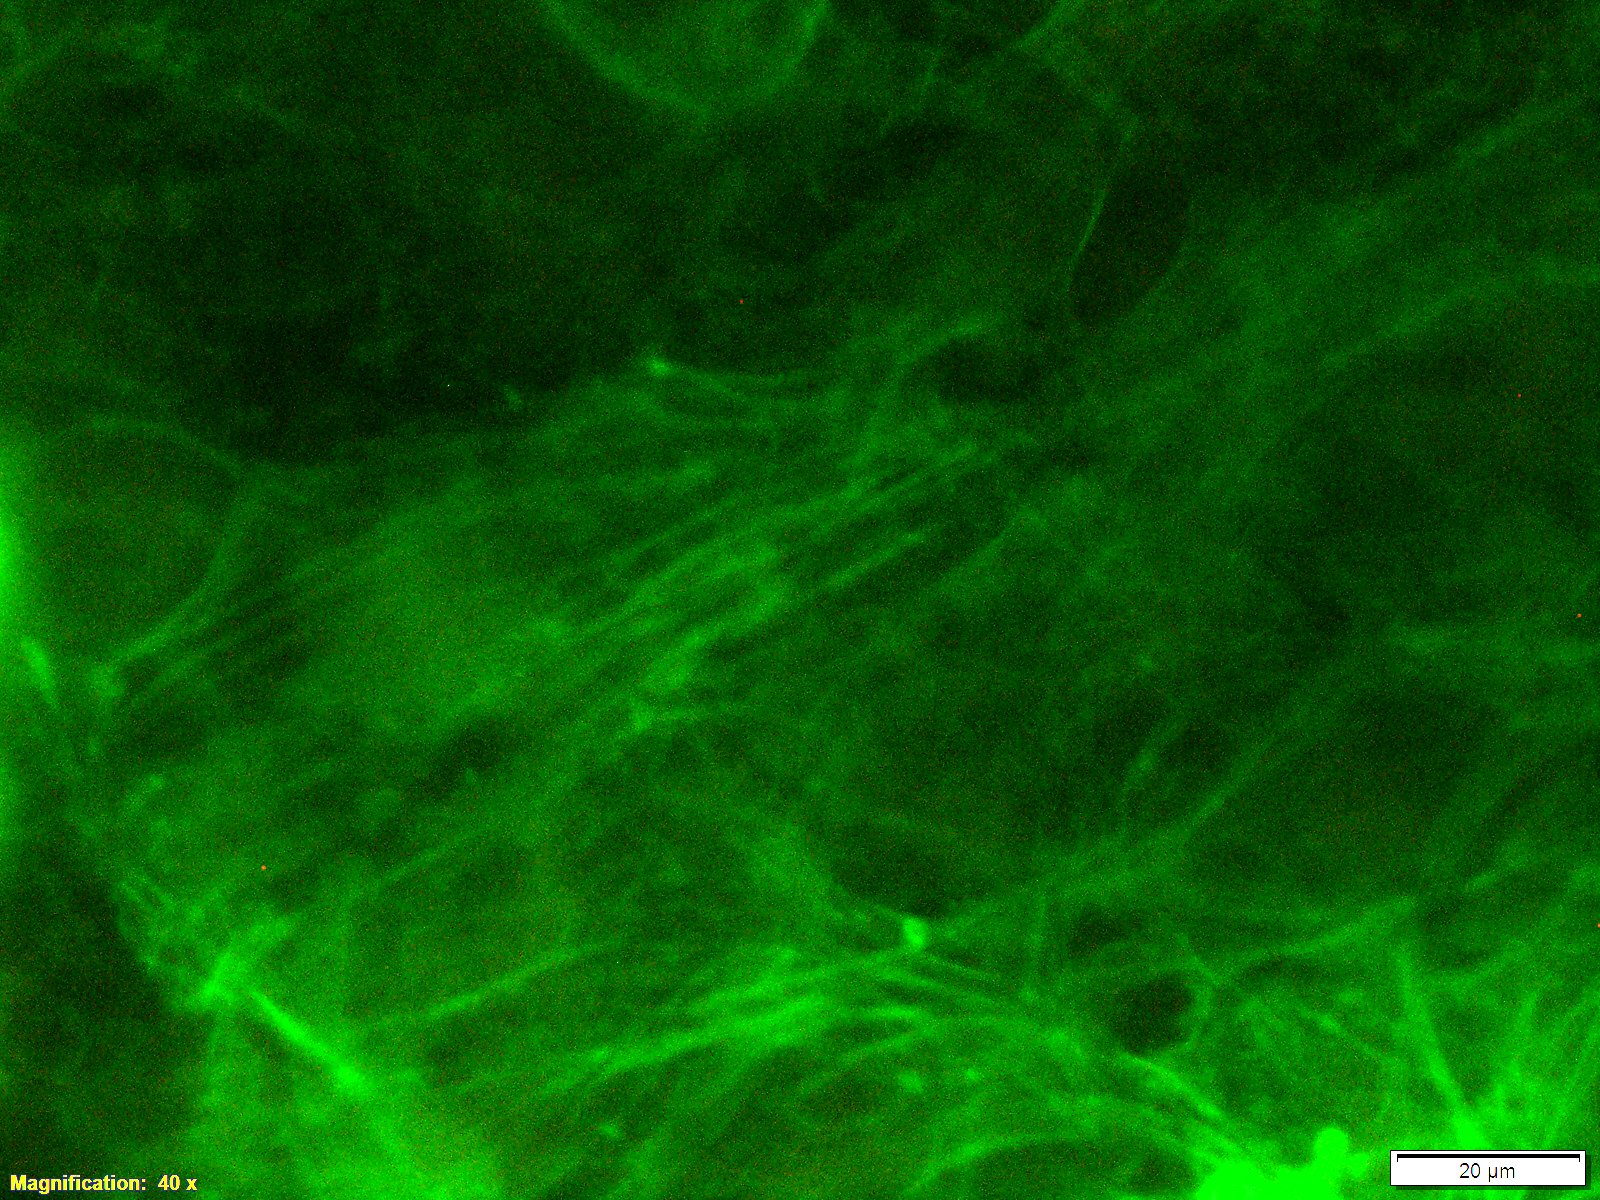
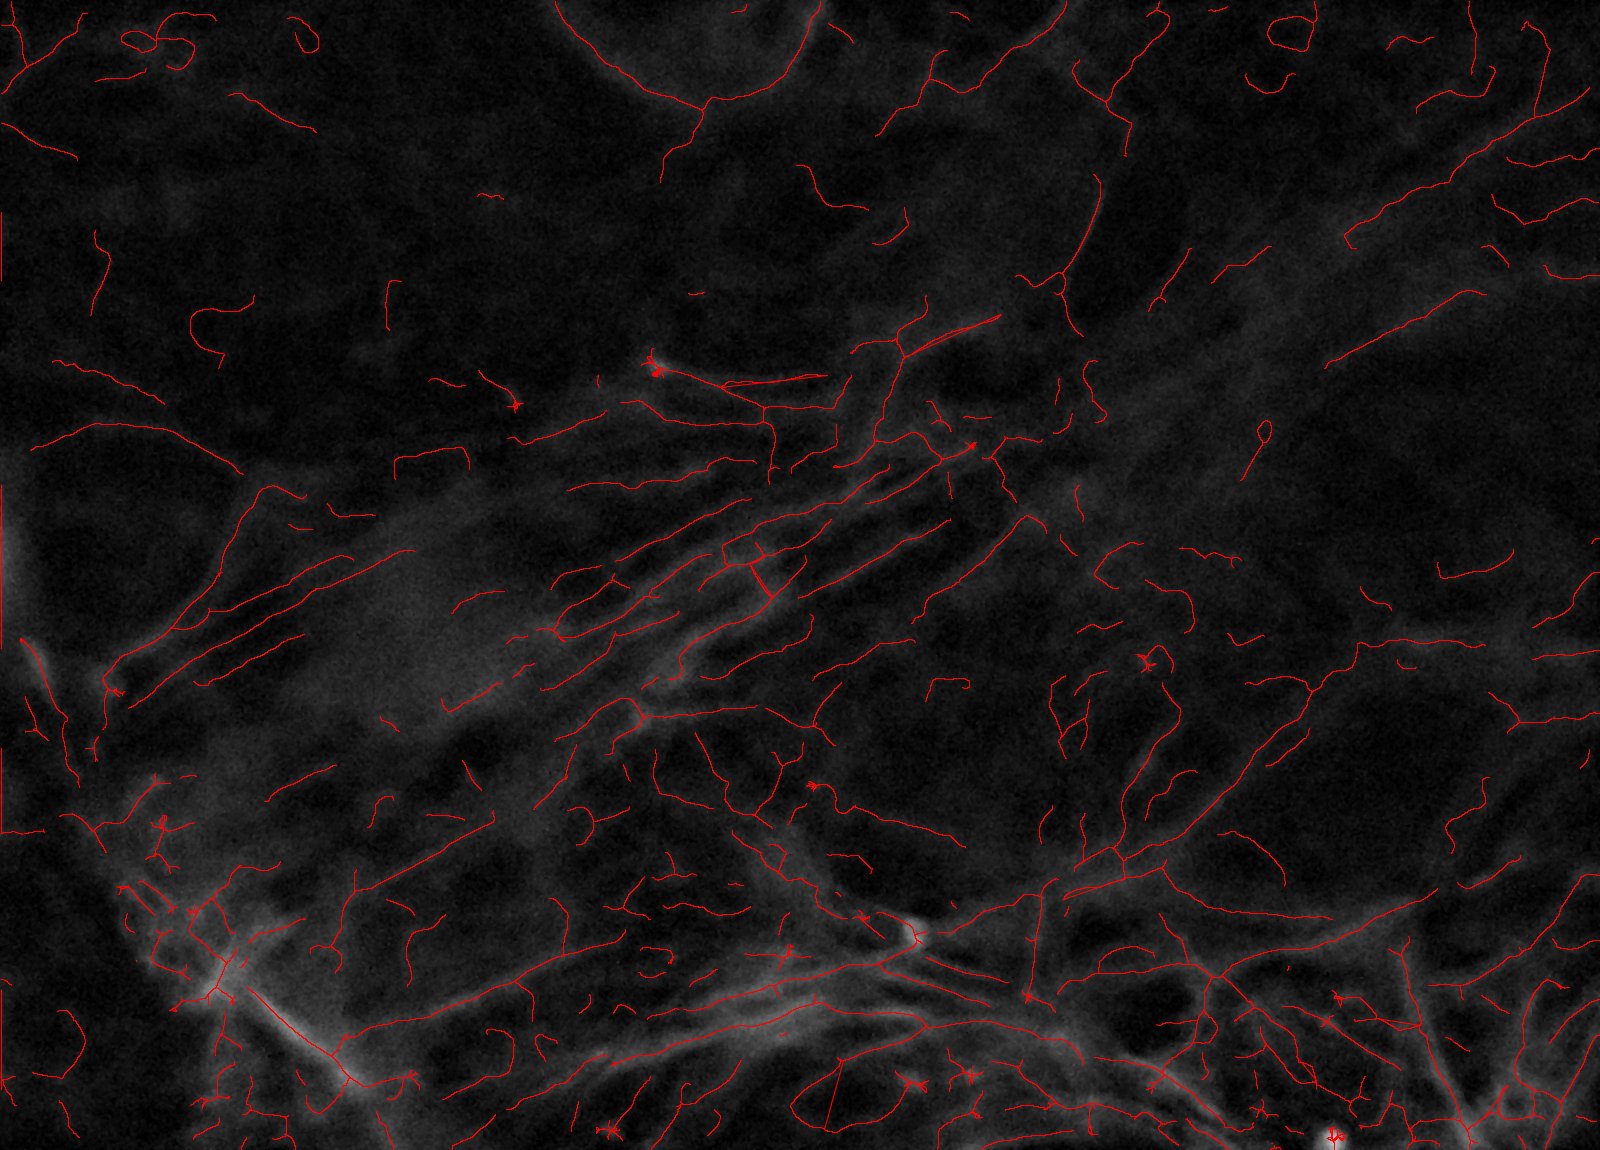
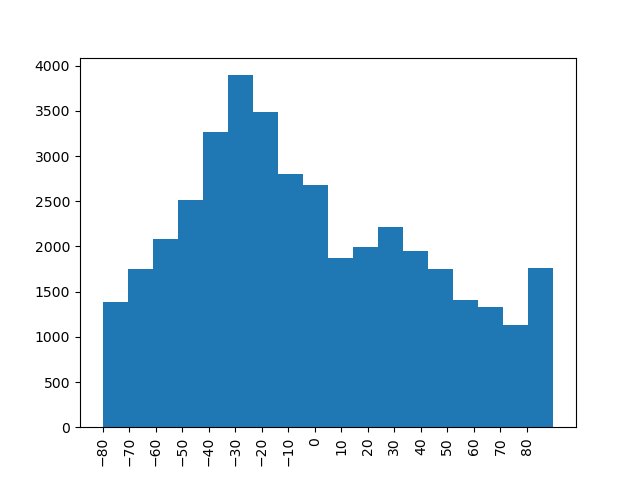
Example 4 – Actin filaments orientation
This example analyses actin fiber orientation in cells as result of external mechanical stimulation. The actin fibers were identified in ImageJ, all line segments coordonates were saved in a separate file and data were then analysed in Python to obtain histograms summarizing the orientations of all identified actin fibers.